

移動平均線の傾きを表示させるインジケーター
移動平均線の傾きを表示させるインジケーターをサブウィンドウに表示させていきたいと思います。
メタエディタ(MetaEditor)を立ち上げる
メタエディタ(MetaEditor)を立ち上げましょう。操作は以下に記載しています。

今回は名前を「Ma-angle」で作成します。
プロパティを記述する
プロパティを記述しましょう。
今回はメインウィンドウではなく、サブウィンドウに表示させるのでseparate_windowを指定します。
#property indicator_separate_window//サブウィンドウ
- メインウィンドウに表示させる場合: indicator_chart_window
- サブウィンドウに表示させる場合:separate_window
オシレーター系などはseparate_windowを使うことがありますので、違いを理解しておきましょう。
今回はバッファは一つだけです。
#property indicator_buffers 1//バッファ1つ
色は青色を指定しましょう。
#property indicator_color1 clrDodgerBlue//青色
線は実線に指定します。
#property indicator_style1 STYLE_SOLID//実線
線の幅は2にしていします。
#property indicator_width1 1//幅1
これでプロパティの記述は完了です。
#property indicator_separate_window//サブウィンドウ
#property indicator_buffers 1//バッファ1つ
#property indicator_color1 clrDodgerBlue//青色
#property indicator_style1 STYLE_SOLID//実線
#property indicator_width1 1//幅1
バッファを定義
バッファを定義しましょう。slope[]という名前のバッファを作成します。
double slope[];
パラメーターを記述する
パラメーターを記述しましょう。パラメーターを記述することによって、
後からインジケーターを使うユーザーが自由に期間や種類を選択することができます。
slope_periodで傾き算出の期間を設定します。
input int slope_period = 1;//傾き算出の期間
次にma_periodで移動平均線の期間を設定します。
input int ma_period = 20;//移動平均線の期間
次にma_shiftで表示移動を設定します。
input int ma_shift = 0;//表示移動
次にma_methodでMAの計算方法を設定します。0:SMA,1:EMA,2:SMMA,3:LWMAという感じです。
input int ma_method = 0;//計算方法{0:SMA,1:EMA,2:SMMA,3:LWMA}
最後にma_priceで計算価格を設定します。0:終値,1:始値,2:高値,3:安値,4:中央値,5:代表値,6:加重終。という感じです。
input int ma_price = 0;//計算価格{0:終値,1:始値,2:高値,3:安値,4:中央値,5:代表値,6:加重終値}
これでパラメーターの記述は完了です。
input int slope_period = 1;//傾き算出の期間
input int ma_period = 20;//移動平均線の期間
input int ma_shift = 0;//表示移動
input int ma_method = 0;//計算方法{0:SMA,1:EMA,2:SMMA,3:LWMA}
input int ma_price = 0;//計算価格{0:終値,1:始値,2:高値,3:安値,4:中央値,5:代表値,6:加重終値}
OnInit()関数を記述する
OnInit()関数を記述しましょう。
slope_period <= 0は、もし角度が0以下の場合は表示されないようになっています。
角度が0の場合は、「Invalid parameter value. slope_period」のアラートを表示されます。
if(slope_period <= 0)//slope_periodが0以下の場合
{
   Alert("Invalid parameter value. slope_period");//アラートを表示
   return(INIT_FAILED);
}
SetIndexBuffer(0, slope)でインデックス0にslopeを紐付けします。
SetIndexBuffer(0, slope);//インデック0にslopeを紐付け
SetIndexLabel(0, “MA Slope”)はラベル表示で、MA Slopeという名前を表示させます。
SetIndexLabel(0, "MA Slope");//インデック0にMA Slopeのラベルを貼る
IndicatorDigitsは、インジケータ値表示の精度フォーマット(小数点以下の桁数)を設定します。
IndicatorDigits(Digits);//インジケータ値表示の精度フォーマット
これでOnInit()関数の記述は完了です。
if(slope_period <= 0)//slope_periodが0以下の場合
 {
   Alert("Invalid parameter value. slope_period");//アラートを表示
   return(INIT_FAILED);
 }
 SetIndexBuffer(0, slope);//インデック0にslopeを紐付け
 SetIndexLabel(0, "MA Slope");//インデック0にMA Slopeのラベルを貼る
 IndicatorDigits(Digits);//インジケータ値表示の精度フォーマット
  return(INIT_SUCCEEDED);
OnCalculate()関数を記述する
OnCalculate()関数を記述しましょう。
変数を2つ用意します。
double ma1, ma2;//MAの変数
未だ計算されていないバー数(チャート上のバー数 – 計算済みバー数)を取得します。
int limit = Bars-IndicatorCounted();//未だ計算されていないバー数(チャート上のバー数 - 計算済みバー数)
傾きは現在の足(ma1)での移動平均線の値と、1本前の移動平均線(m2)の値から算出します。
ma2のシフトはinputのslope_periodの期間になります。
ma1 = iMA(_Symbol, 0, ma_period, ma_shift, ma_method, ma_price, i);//現在のMA
ma2 = iMA(_Symbol, 0, ma_period, ma_shift, ma_method, ma_price, i + slope_period);//slope_period分ずらしたMA
ma1とma2を引いてその値をslope_periodの数値で割ったものが傾きになります。
slope[i] = (ma1 - ma2) / slope_period;//角度を算出する
また、傾きの単位は価格になります。
移動平均線がローソク足1本ごとに0.1円上昇している場合は、傾きは0.1円となっています。
パラメーターのslope_periodを変更することでもっと長い期間での傾きを算出することも可能です。
   double ma1, ma2;//MAの変数
   int limit = Bars-IndicatorCounted();//未だ計算されていないバー数(チャート上のバー数 - 計算済みバー数)

   for(int i = limit - 1; i >= 0; i--)
   {
      ma1 = iMA(_Symbol, 0, ma_period, ma_shift, ma_method, ma_price, i);//現在のMA
      ma2 = iMA(_Symbol, 0, ma_period, ma_shift, ma_method, ma_price, i + slope_period);//slope_period分ずらしたMA
      slope[i] = (ma1 - ma2) / slope_period;//角度を算出する
   }
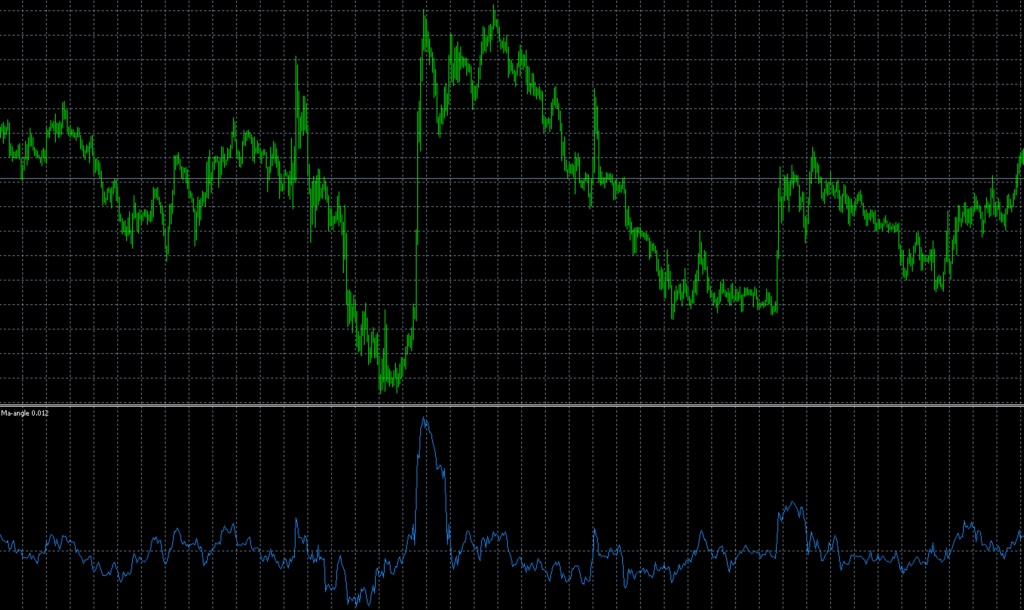
コンパイルする
コンパイルしましょう。サブウィンドウにMAの傾きが表示されていたら完了です。
ソースコード全体
Ma-angleのソースコード全体は以下に記載しています。
//+------------------------------------------------------------------+
//|                                                     Ma-angle.mq4 |
//|                     Copyright 2020, FX-EA System Project Creator |
//|                        https://creator.fx-ea-system-project.com/ |
//+------------------------------------------------------------------+
#property copyright "Copyright 2020, FX-EA System Project Creator"
#property link      "https://creator.fx-ea-system-project.com/"
#property version   "1.00"
#property strict
/*プロパティ*/
#property indicator_separate_window
#property indicator_buffers 1//バッファ1つ
#property indicator_color1 clrDodgerBlue//青色
#property indicator_style1 STYLE_SOLID//実線
#property indicator_width1 1//幅1

/*バッファ*/
double slope[];

/*パラメーター*/
input int slope_period = 1;/ 傾き算出の期間
input int ma_period = 20; //移動平均線の期間
input int ma_shift = 0;//表示移動
input int ma_method = 0;//計算方法{0:SMA,1:EMA,2:SMMA,3:LWMA}
input int ma_price = 0;//計算価格{0:終値,1:始値,2:高値,3:安値,4:中央値,5:代表値,6:加重終値}

//+------------------------------------------------------------------+
//| Custom indicator initialization function                         |
//+------------------------------------------------------------------+
int OnInit()
  {
//--- indicator buffers mapping
  if(slope_period <= 0)//slope_periodが0以下の場合
 {
   Alert("Invalid parameter value. slope_period");//アラートを表示
   return(INIT_FAILED);
 }
 SetIndexBuffer(0, slope);//インデック0にslopeを紐付け
 SetIndexLabel(0, "MA Slope");//インデック0にMA Slopeのラベルを貼る
 IndicatorDigits(Digits);//インジケータ値表示の精度フォーマット
  return(INIT_SUCCEEDED);
}
//+------------------------------------------------------------------+
//|Custom indicator iteration function |
//+------------------------------------------------------------------+
int OnCalculate(const int rates_total,
                const int prev_calculated,
                const datetime &time[],
                const double &open[],
                const double &high[],
                const double &low[],
                const double &close[],
                const long &tick_volume[],
                const long &volume[],
                const int &spread[])
{
   double ma1, ma2;//MAの変数
   int limit = Bars-IndicatorCounted();//未だ計算されていないバー数(チャート上のバー数 - 計算済みバー数)

   for(int i = limit - 1; i >= 0; i--)
   {
      ma1 = iMA(_Symbol, 0, ma_period, ma_shift, ma_method, ma_price, i);//現在のMA
      ma2 = iMA(_Symbol, 0, ma_period, ma_shift, ma_method, ma_price, i + slope_period);//slope_period分ずらしたMA
      slope[i] = (ma1 - ma2) / slope_period;//角度を算出する
   }
//--- return value of prev_calculated for next call
   return(rates_total);
  }
//+------------------------------------------------------------------+
まとめ
移動平均線の角度を算出することができましたね。
角度を活用できるようになると他のインジケーターでも応用が効きますので、ぜひマスターしましょう。


コメント