

2つの種類の違う移動平均線を表示させるインジケーター
前回は1つの移動平均線を表示できたので、
今度は異なる種類の移動平均線を表示させるインジケーターを作成していきましょう。
SMAとEMAの2つの種類の移動平均線を表示させたいと思います。
- SMAの移動平均線を表示させる
- EMAの移動平均線を表示させる
メタエディタを開く
メタエディタ(MetaEditor)を立ち上げましょう。操作は以下に記載しています。

今回は名前を「ma-sample2」で作成します。
プロパティを記述する
今回は2つの移動平均線を使うので2つのプロパティを記述します。
バッファも2つ用意します。
1つ目の移動平均線は
- 赤色
- SOLID
- 幅3
2つ目の移動平均線は
- 黄色
- SOLID
- 幅3
です。
まずは移動平均線を2つ表示させるためにバッファを2つ用意しましょう。
#property indicator_buffers 2//バッファ2つ
次に色を指定します。
#property indicator_color1 Red//赤色
#property indicator_color2 Yellow//黄色
次に線を実線にします。
#property indicator_style1 STYLE_SOLID//実線
#property indicator_style2 STYLE_SOLID//実線
最後に線の幅を決めます。
#property indicator_width1 3//幅3
#property indicator_width2 3//幅3
これでプロパティの記述は完了です。
#property indicator_buffers 2//バッファ2つ
#property indicator_color1 Red//赤色
#property indicator_color2 Yellow//黄色
#property indicator_style1 STYLE_SOLID//実線
#property indicator_style2 STYLE_SOLID//実線
#property indicator_width1 3//幅3
#property indicator_width2 3//幅3
バッファを定義する
バッファの定義します。今回は移動平均線が2つなのでバッファも2つ用意します。
sma[]とema[]の2つのバッファを作りましょう。
double sma[];//バッファ定義
double ema[];//バッファ定義
これでバッファの定義は完了です。
double sma[];//バッファ定義
double ema[];//バッファ定義
OnInit()関数に記述する
OnInit()関数に記述していきます。
今回は配列を2つ使うので、SetIndexBufferも0と1の2つを使います。
0にsmaの配列を紐付けして、1にemaの配列を紐付けします。
SetIndexBuffer(0,sma);//インデックス0にsma配列を紐付け
SetIndexBuffer(1,ema);//インデックス1にema配列を紐付け
これでOnInit()関数の記述は完了です。
SetIndexBuffer(0,sma);//インデックス0にsma配列を紐付け
SetIndexBuffer(1,ema);//インデックス1にema配列を紐付け
OnCalculate()関数に記述する
OnCalculate()関数に記述にはiMA関数の情報を記述していきます。
前回は1つでしたが、今回は2つ必要になります。
今回は
- 期間20
- SMAとEMAを1つずつ
表示させていきます。
まずは、いつもどおりに未計算のバーを計算します。
int limit = Bars-IndicatorCounted();//未だ計算されていないバー数(チャート上のバー数 - 計算済みバー数)
つぎにfor文でいつもどおりに繰り返し計算させます。
for(int i=0; i < limit; i++)
最後にfor文の条件が満たされている場合に移動平均線を表示させましょう。
sma[i] = iMA(NULL, 0, 20, 0, MODE_SMA, PRICE_CLOSE, i);//期間20のSMA
ema[i] = iMA(NULL, 0, 20, 0, MODE_EMA, PRICE_CLOSE, i);//期間20のEMA
これでOnCalculate()関数の記述は完了です。
int limit = Bars-IndicatorCounted();//未だ計算されていないバー数(チャート上のバー数 - 計算済みバー数)
   for(int i=0; i < limit; i++)
   {
      sma[i] = iMA(NULL, 0, 20, 0, MODE_SMA, PRICE_CLOSE, i);//期間20のSMA
      ema[i] = iMA(NULL, 0, 20, 0, MODE_EMA, PRICE_CLOSE, i);//期間20のEMA
}コンパイルする
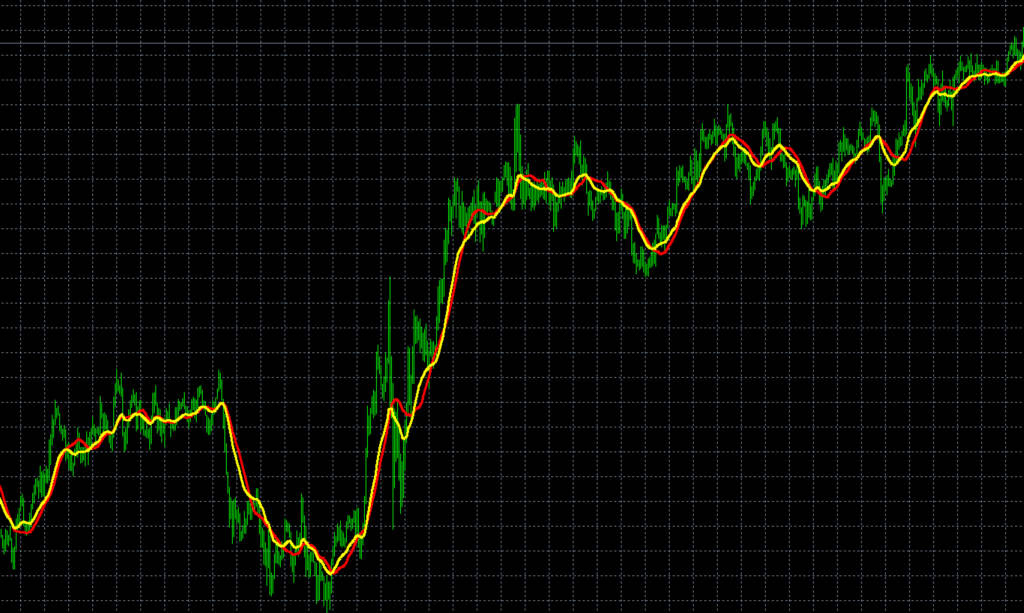
コンパイルしてチャートにセットして赤色と黄色の移動平均線が表示されていればOKです。
ソースコード全体
ma-sample2のソースコード全体は以下に記載しています。
//+------------------------------------------------------------------+
//|                                                   ma-sample2.mq4 |
//|                     Copyright 2020, FX-EA System Project Creator |
//|                        https://creator.fx-ea-system-project.com/ |
//+------------------------------------------------------------------+
#property copyright "Copyright 2020, FX-EA System Project Creator"
#property link      "https://creator.fx-ea-system-project.com/"
#property version   "1.00"
#property strict
#property indicator_chart_window
#property indicator_buffers 2//バッファ2つ
#property indicator_color1 Red//赤色
#property indicator_color2 Yellow//黄色
#property indicator_style1 STYLE_SOLID//実線
#property indicator_style2 STYLE_SOLID//実線
#property indicator_width1 3//幅3
#property indicator_width2 3//幅3
double sma[];//バッファ定義
double ema[];//バッファ定義

//+------------------------------------------------------------------+
//| Custom indicator initialization function                         |
//+------------------------------------------------------------------+
int OnInit()
  {
//--- indicator buffers mapping
   SetIndexBuffer(0,sma);//インデックス0にsma配列を紐付け
   SetIndexBuffer(1,ema);//インデックス`にema配列を紐付け
//---
   return(INIT_SUCCEEDED);
  }
//+------------------------------------------------------------------+
//| Custom indicator iteration function                              |
//+------------------------------------------------------------------+
int OnCalculate(const int rates_total,
                const int prev_calculated,
                const datetime &time[],
                const double &open[],
                const double &high[],
                const double &low[],
                const double &close[],
                const long &tick_volume[],
                const long &volume[],
                const int &spread[])
  {
//---
int limit = Bars-IndicatorCounted();//未だ計算されていないバー数(チャート上のバー数 - 計算済みバー数)
   for(int i=0; i < limit; i++)
   {
      sma[i] = iMA(NULL, 0, 20, 0, MODE_SMA, PRICE_CLOSE, i);//期間20のSMA
      ema[i] = iMA(NULL, 0, 20, 0, MODE_EMA, PRICE_CLOSE, i);//期間20のEMA
   }
//--- return value of prev_calculated for next call
   return(rates_total);
  }
//+------------------------------------------------------------------+まとめ
これで2つの種類の移動平均線を表示することができましたね。
今回のソースコードを応用すれば、何本でも移動平均線を表示させることができるようになりましたね。


コメント